This course takes a deeper look at how to analyze data by using PivotTables in Excel 2016. You must be able to organize your data so it is easy to understand and interpret. You can also filter the data found in a PivotTable or change the format of the PivotTable itself to ensure you have provided enough functionality without cluttering the overall experience. This course shows you how to accomplish these tasks. A PivotTable is a powerful feature in Excel. It allows you to extract specific pieces of information from a larger set of data; in short, it allows you to focus on what you determine to be the important parts of that data. Utilize the information presented here and understand how to better sort, analyze, and present your data through PivotTables.
Purchase Course: Great for individuals or small teams and is completed on a per-seat basis at checkout.
Bulk Licensing: Great for large teams and routes you to our sales team to set up access for your organization.
Chapters
- 1. Summarize PivotTable Data
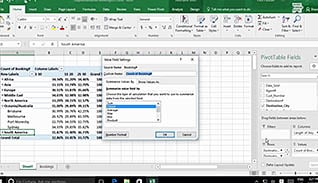
- 2. Organize PivotTable Data
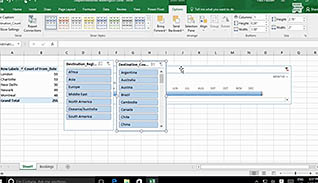
- 3. Filter PivotTable Data
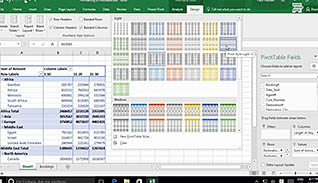
- 4. Format A PivotTable
- 5. Refresh And Change PivotTable Data