New Cyber Security Training! Browse Courses Here
Course ID: bbrnmebe5_vod
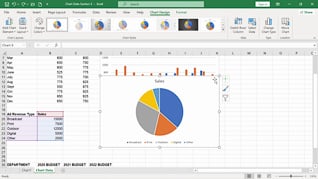
Mastering Excel 365 – Beginner Part 5: Charts And Graphics
Visualizing data makes it easier to identify trends and communicate insights, which is why charts remain one of Excel’s most widely used features. This course teaches you how to create charts and insert graphics that make your spreadsheets more engaging and easier to understand. You will learn how to present data visually, highlight key information, and build reports that are both professional and easy to interpret. The result of this course is simple: clearer communication and more impactful spreadsheets.
Purchase Course: Great for individuals or small teams and is completed on a per-seat basis at checkout.
Bulk Discounts: Great for large teams and routes you to our sales team to set up access for your organization.
Please Note: Completing an online course may not fulfill all compliance requirements. Many OSHA and HR regulations also require written programs, hands-on training, or site-specific components. Always verify requirements with your employer or regulatory authority.
Chapters
- 1. Creating Charts
- 2. Inserting Graphics