New Cyber Security Training! Browse Courses Here
Course ID: bbrnmeba4_vod
Mastering Excel 365 – Basics Part 4: Charts And Tables
This online training course introduces Office 365 users to creating charts, tables, and PivotTables in Microsoft Excel 365. Users taking this course will learn how to organize and present data more effectively using Excel’s built-in tracking and reporting tools. Throughout the course, learners see how to create and modify different chart types to display information clearly and professionally. The training also explains how to update chart source data, customize chart elements, and format tables for improved organization and readability. In addition, employees learn how to create PivotTables to quickly summarize, analyze, and interpret larger amounts of data.
Purchase Course: Great for individuals or small teams and is completed on a per-seat basis at checkout.
Bulk Discounts: Great for large teams and routes you to our sales team to set up access for your organization.
Please Note: Completing an online course may not fulfill all compliance requirements. Many OSHA and HR regulations also require written programs, hands-on training, or site-specific components. Always verify requirements with your employer or regulatory authority.
Chapters
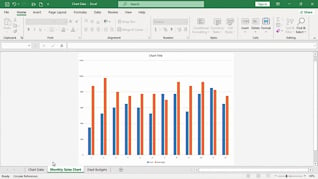
- 1. Changing Chart Types
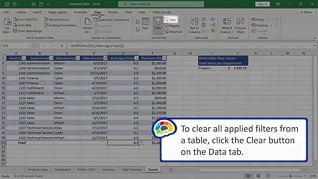
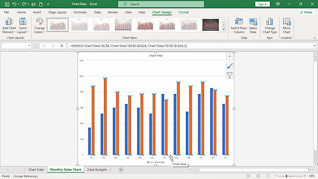
- 2. Changing Chart Source Data
- 3. Creating A Table
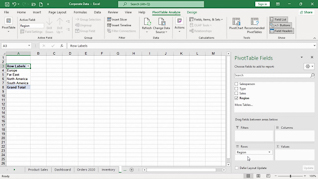
- 4. Creating A PivotTable