Microsoft Excel 2016 Level 2.5: Using PivotTables and PivotCharts
- Product ID
- sonie16up_vod
- Training Time ?
- 20 to 28 minutes
- Language(s)
- English
- Video Format
- High Definition
- Required Plugins
- None
- Number of Lessons
- 4
- Quiz Questions
- 8
- Closed Captioning
- Question Feedback
- Wrong Answer Remediation
- Lesson Bookmarking
- Downloadable Resources


An Excel PivotTable is a powerful tool for making sense out of a large set of data. This course teaches viewers how to work with PivotTables and PivotCharts in Microsoft Excel 2016.
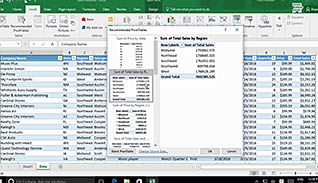
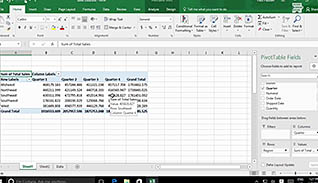
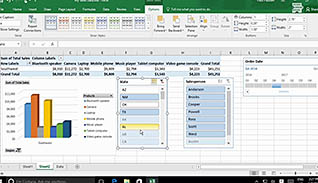
This training video shows examples of how to use Microsoft Excel 2016 PivotTables to manage data. This video explains the difference between regular tables and PivotTables. The course demonstrates how to create a PivotChart from a PivotTable, and how to use Timelines and Slicers to further filter data.
Microsoft Excel 2016 PivotTables and PivotCharts are useful tools for managing and presenting data. This video shows viewers how to use Microsoft Excel 2016 PivotTables and PivotCharts effectively.
![]() This course is in the Video On Demand format, to read about Video On Demand features click here.
This course is in the Video On Demand format, to read about Video On Demand features click here.

- Install on any SCORM LMS
- Full-screen video presentation
- Print certificate and wallet card
- You have 30 days to complete the course
Excel 2016 users
- Create a PivotTable
- Analyze PivotTable Data
- Present Data with PivotCharts
- Filter Data by Using Timelines and Slicers
-
Create a pivot table.
- Recall what pivot tables are designed to do.
- Identify the steps for creating a pivot table.
-
Analyze pivot table data.
- Identify the first step in creating a pivot table.
- Determine the key components for creating pivot tables.
-
Present data with pivot charts
- Recall what is affected when filtering is applied to pivot charts.
-
Filter data by using timelines and slicers.
- Recall the steps to creating a timeline.
- Identify the meaning of the different shades when creating slicers.
© Mastery Technologies, Inc.


